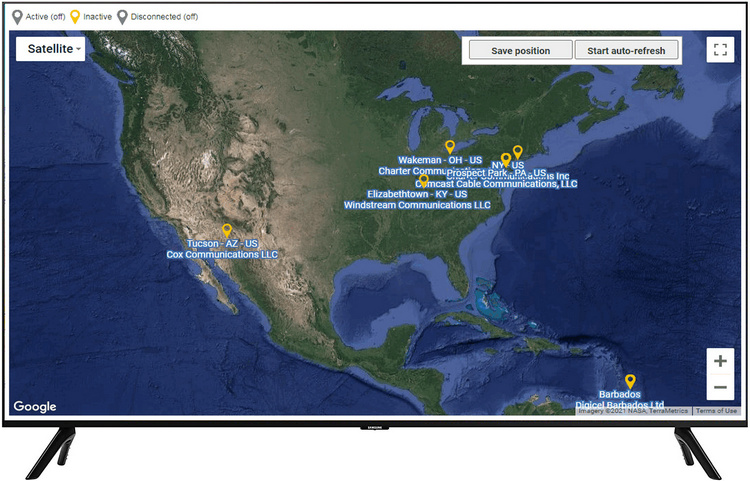
The ISP Tracker Internet/network monitoring tools include an overview map for enterprise users. It shows all locations and ISPs being monitored with the choice of what to be alerted for.
Filter to view all locations or show only those which have not communicated for at least around 30 seconds or have been offline for 30 minutes.
Combinations of the above and others can be selected and monitored. The viewer can also switch between active monitoring or an alerts view, each explained below.
The following are a few examples of what the overview map would show for localized monitoring.
Click on any of the images to see it larger.


Monitor certain areas of the city for ISP performance and/or analysis.
Zoom in on problem areas to see location specific information and statuses.
Perfect for smaller cities, rural areas where ISPs may have problems with reliability.
Visually identify areas experiencing Internet problems. Know before the calls start.
For wider-scale monitoring
The above examples show monitoring on a small scale, in certain areas where the map can be zoomed in to view specific areas.
When monitoring on a wider scale, and when problems are far reaching, the overview map will provide a quick way of knowing that something affecting one or more ISP’s is in progress.
Statuses view
The overview map provides a way for a single person to monitor dozens, hundreds, or thousands of locations that may experience communication issues. A quick peek at a dedicated monitor or large-screen TV shows any and all locations that may be having problems.
ISPs are well known for being slow to report anything but large-scale outages if they are reported at all. Installing agents is a two-minute process either by IT personnel or someone at the location.
ISP Tracker is a highly cost-effective monitoring solution and Echo Networks LLC is a flexible company to work with, always open to new ideas, and how we can improve our services.
Statuses (timing)
The following are the time frames that we use to determine the three main statuses.
Note that due to many factors such as how busy the agent is or the speed of its LAN or Internet connection, timing is never perfectly accurate.
Active
A green Active status means that the location is online and reachable.
Inactive
A yellow icon means that the agent has not communicated with its home base for around 20 to 30 seconds.
Inactive without an outage means that something other than an IP problem is causing communications issues at this location. This could mean a faulty cable, a LAN device being restarted, low signal levels locally or nearby if connectivity is provided by cable or wireless, and so on.
If there is in fact an IP outage, the agent will send its report with details when it is able to communicate again.
Disconnected
A red icon means this location has not communicated for at least 30 minutes. It’s dashboard will show the last time that it communicated with the ISP Tracker network.
As above, if there is in fact an outage in progress, the agent will send it’s report with details when it is able to communicate again.
In any of the above situations, personnel can be alerted via email, SMS or the person monitoring the overview map.
Alerts Overview
Alerts can be used in addition to email and SMS notifications and offer a level of accountability.
When alerts are used, they not only get displayed on the map until someone deals with them but they are shown on the dashboard of each individual agent that generated one.
The first step requires that someone acknowledge the alert and the second step requires that whoever dealt with the issue must also enter a note about what happened, what was done and by whom. These notes are then kept historically so that admins and management alike can have a report of events surrounding this location.
In the Alerts view, the map shows any and all alerts which have not been dealt with. Once someone has closed the alert, it will no longer show on the map or in the agent’s dashboard.
Once an alert is cleared by that location’s admin, it is no longer shown on the map.
Types of alerts
The following is a list of alerts that can be shown on the map in any combination.
Multiple
This location has experienced or is experiencing multiple alerts. Multiple alerts include any of the following alerts.
Inactive
The agent stopped communicating for at least 30 seconds or so.
Unauthorized port
If a security scan is enabled, an unauthorized IP port was or is still open.
Environment
If an optional sensor is included at this location, this shows alerts such as low/high temps, high moisture, low/high light source, high vibration, etc.
Low bandwidth
The agent has or is experiencing a low bandwidth minimum set by the admin.
Disconnected
The agent has or is disconnected. No communication for at least 30 min.
Outage
This location has suffered a confirmed IP outage.
Back online
This location has started communicating again after being offline. Saves on sending personnel to the location.
The overview map is just one of many tools you’ll find available to your company and team. Based on your requirements, our www.outagesio.com or our www.mspsensors.com services may be what you are looking for.